
Cellular Biology
The peroxisomes
Discover peroxisomes, small cellular organelles that are key to the survival and adaptation of our cells! In this cell biology course, you'll explore their structure...
Biostatistics
Expand your biostatistics skills with this course titled "Descriptive and Inferential Statistics." You will learn how to interpret and use descriptive statistics (mean, median, mode, etc.) and inferential statistics (standard error hypothesis, Student t-tests, ANOVA, etc.), applying these principles to biological data.

This comprehensive course is designed to provide advanced students of biology with a thorough understanding of the concepts of descriptive and inferential statistics. The significance of these statistical tools lies in their ability to analyze and interpret complex biological data, providing insights into patterns, trends, and relationships that can be used to make informed decisions and draw valid conclusions.
Descriptive statistics offer a means to summarize and organize data in an easily understandable format. The primary goal is to condense large sets of information into a few representative values, making it simpler to analyze and compare datasets. These techniques are crucial in biology as they facilitate the analysis of numerous variables, enabling researchers to identify patterns, trends, and relationships within their study populations.
The arithmetic mean is calculated by summing all data values and dividing the total by the number of values. It provides a single value that represents the central tendency for a dataset. The formula for the mean is:
Mean = Sum of all data values / Number of data values
When dealing with skewed or outlier-prone datasets, the median can offer a more reliable measure of centrality. To calculate the median, first, arrange the data in order from smallest to largest and locate the middle value (or average of the two middle values if the dataset has an even number of observations).
The mode represents the most frequently occurring value(s) within a dataset. In some cases, datasets may have more than one mode or no discernible mode at all.
The range is calculated as the difference between the largest and smallest values in a dataset. It provides an indication of the spread of data within a dataset.
Variance offers a more refined measure of dispersion by quantifying the average deviation from the mean. The formula for variance is:
Variance = (Sum of squared deviations from the mean) / (Number of data values - 1)
The standard deviation is the square root of the variance and offers a more intuitive representation of dispersion. It provides a measure of how spread out the data is, with higher values indicating greater variability within the dataset.
Inferential statistics rely on probability distributions to determine the likelihood of observed outcomes. Two common probability distributions used in biology are the normal distribution (Gaussian) and the chi-squared distribution.
Hypothesis testing involves testing a null hypothesis (the status quo or no difference) against an alternative hypothesis (the researcher's proposed idea). The process includes:
A confidence interval provides an estimate of a population parameter, along with a range within which the true value is likely to lie. This interval is calculated using sample data and a specified level of confidence (e.g., 95% or 99%).
The significance level represents the probability of rejecting the null hypothesis when it is true. A commonly used significance level is 0.05, which corresponds to a 5% chance of making a type I error (rejecting the null hypothesis when it should not have been rejected).
Descriptive and inferential statistics play essential roles in analyzing gene expression data, enabling researchers to understand patterns of gene regulation, identify genetic associations, and investigate molecular mechanisms underlying biological processes.
Statistical tools are indispensable for studying populations and the evolutionary processes that shape them. Descriptive statistics aid in characterizing population traits, while inferential statistics help evaluate genetic drift, selection, and migration, among other factors influencing evolutionary change.
هل تعتقد أنك تعرف كل شيء عن هذه الدورة؟ لا تقع في الفخاخ، تدرب مع الأسئلة المتعددة الأسئلة! eBiologie لديه مئات الأسئلة لمساعدتك في إتقان هذا الموضوع.
Discover peroxisomes, small cellular organelles that are key to the survival and adaptation of our cells! In this cell biology course, you'll explore their structure...
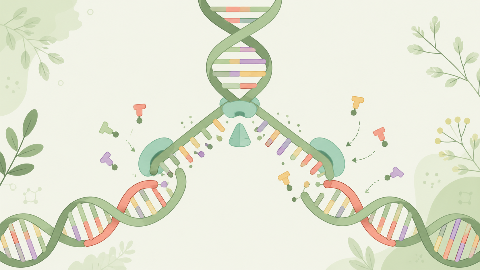
Discover how our DNA replicates with each cell division in this molecular biochemistry course: "DNA Replication." You'll learn the key steps in this crucial process...
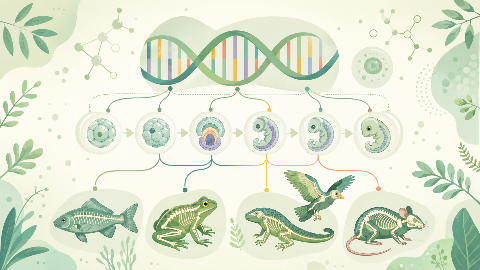
Learn about evolutionary developmental biology, the field that studies the mechanisms of embryonic development and their evolution at the molecular, cellular, and st...